Saturday, April 1, 2017

Proposed Pipelines to Neighborhoods in Boston

Description: Pipelines are believed to bring people convenience of resources, however, they truth is that they can cause serious hazards to people and the environment for many years if they they crack, leak or spill.  According to the Pipeline and Hazardous Materials Safety Administration, in a 3 year span there were over 1,800 incidents from various distribution and hazardous liquids.
    In looking at the city of Boston, Massachusetts, I looked at data of proposed pipelines. After merging and analyzing data, I found out what towns in Boston, Massachusetts that would be effected by these proposed pipelines.

Table 1: List of towns effected

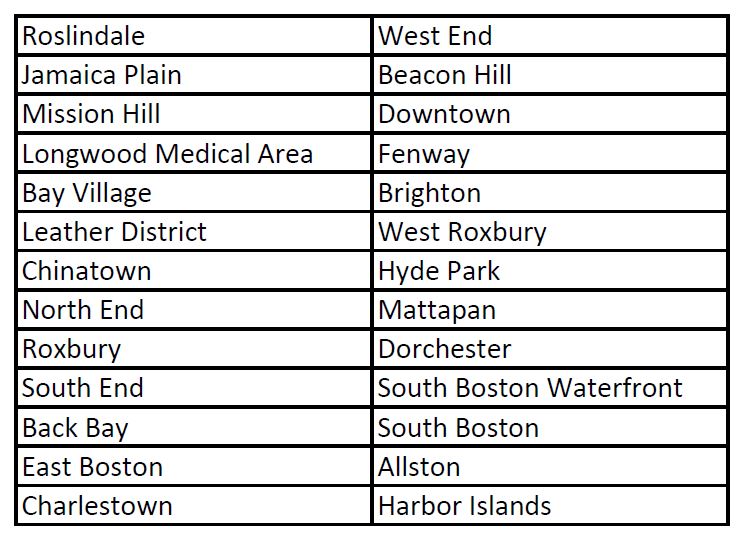
Analysis: Several proposed pipelines run through Boston, Massachusetts and several connecting pipelines would effect the towns of Roslindale, Jamaica Plain, Mission Hill, Longwood Medical Area, Bay Village, Leather District, Chinatown, North End, Roxbury, South End, Back Bay, East Boston, Charlestown, West End, Beacon Hill, Downtown, Fenway, Brighton, West Roxbury, Hyde Park, Mattapan, Dorchester, South Boston Waterfron, South Boston, Allston, Harbor Islands.
Map: Proposed Pipelines to Neighborhoods in Boston 

Limitations: While many towns are effected, this city is highly populated and adding population data would be benefical as well as evacuation routes. 


Sources: ArcMap, ArcGIS, Pipeline and Hazardous Materials Safety Administration
 https://www.fractracker.org/2013/04/us-pipelines-average-incidents-are-a-daily-occurrence/

Wednesday, March 29, 2017


Hubway Stations in Boston, Massachusetts

 within a 5-10 minute walk


Description: By using data from ArcGIS online I located all available hubway stations in Boston, Massachusetts. I then analyzed that data to create a layer that included hubway stations that were within a 5 minute walking distance and another layer of hubway stations that were within a 10 minute walking distance.


Table 1:

Analysis: Boston is a total of 50.16 square miles and an ample amount of hubway stations. 12.87 square miles of hubway stations are within a 5 minute walk. 20.95 square miles are within a 10 minute walk.


Sources: Boston Open data, ArcGIS online

Friday, March 3, 2017

Saturday, February 25, 2017

Loss of Prime Farmland in Easton, Massachusetts

Description: Maggie Payne is a resource soil scientist who is trying to figure out how much prime farmland area has been lost to impervious surface, such as paved parking lots. What we are looking at is the amount of area that is agricultural land, what is it useful for and how can we preserve it. This project is to assist in providing visual data to calculate how much farmland has been lost and if there is a relation to consequences of urbanization.

Table 1:

Count (meters)
Square kilometers
Total study area
82,872
8.29
Prime farmland
92,272
9.23
Farmland of statewide importance
259,205
25.92
Farmland of unique importance
117,147
11.71


Table 2:

Count (meters)
Square kilometers
Prime farmland lost
15,427
1.54
Farmland of statewide importance lost
37,403
3.74
Farmland of unique importance lost
1,689
0.17


Process: We looked at soil data in the town of Easton, Massachusetts. To do that, we first extracted the soil data and combined it within the area of the town. Looking at the new combined data, we got the total number of meters for the total study area size. We then created subsets of geographic data including Prime Farmland, Farmland of statewide importance and Farmland of unique importance. We did that by combining the common field between both data sets. Then again, we then looked at the statistical sum of each subset to get the total count in meters. To get our answer in square kilometers we took our count in meters times 100 and then times 0.0001. We did that for each subset. For each subset, we determined the amount of farmland that has been lost. We created a new text field in our data set. From there, we got our new statics for Prime farmland lost, Farmland of statewide importance lost and Farmland of unique importance lost. From our data we created a map (below) to depict how much farmland has been lost in Easton, Massachusetts. 


Results: From table 1, the total study area size is 82,872 meters or 8.29 square kilometers. The prime farmland is 92,272 meters, or 9.23 square kilometers. The farmland of statewide importance is 259,205 meters, or 25.92 square kilometers. The farmland of unique importance is 117,147 meters, or 11.71 square kilometers. In table 2, the total prime farmland lost is 15,427 meters, or 1.54 square kilometers. The farmland of statewide importance lost is 37,403 meters, or 3.74 square kilometers. The farmland of unique importance lost is 1,689 meters, or 0.17 square kilometers.

Conclusions: Our data shows that the numbers are highest in amount of area of valuable farmland of statewide importance and the amount of farmland of statewide importance that has been lost. Which means, that there is in fact, a relation of how much urbanization affects how much valuable farmland that has been lost. Maggie Payne discussed that factors like ground conditions where not documented when the maps were made, or how much urban land was dominated by impervious surfaces at the time of mapping, as well as the time some of the data was taken. 

Blue Light Maintenance & Safety

Description: Our purpose was to locate the blue light phones for safety and maintenance measures on Bridgewater State University’s entire campus. We wanted to create awareness of where they were, if they are they in good working order, whether you can see another one within walking distance, and if it was accessible for handicap students, police officers and visitors. We also looked at the safety of how well lit the area was and also the closest residence hall and their closing hours. http://arcg.is/2kuix6E

Table 1:
Field
Type of Field
Values
Nearest Building – Close time
Numeric
00:00-24:00
Blue light working
Text
Yes, no
Nearest residence hall
Text
Scott, Woodward, Pope, Crimson, Wegand, Miles, Dinardo, Apartments, Stonehouse, Sheadurgin
Lighting
Text
No Visibility, Low Visibility, Small Visibility, Entire Area Visible
Handicap Accessible
Text
Yes, no
Police Access
Text
No Access, Non-Paved Access, Paved Access, Road Access
Second Visible Blue Light
Text
Yes, no
Time collected information
Numeric
00:00-24:00
Number of students in area
Float
0-1000


Process: We created a map of the campus on Bridgewater State University with all the locations of the emergency blue light phones. As a team, we walked around campus observing and inspected several blue lights. On the one’s we did inspect, we added data about the light itself, whether it was working, bright or dim; if there were others within eyesight, if it was a well-lit area, whether it was handicap accessible, how “busy” the area was, the time we retrieved the information and the closest residence hall. 

Conclusions: We found that out of the several blue emergency lights that we checked, all had working and bright lights, as well as locations in well-lit areas. Some did not have another blue emergency light in sight and some locations had none. The number of students in the area varied from 5-70/80. Surprisingly, some were not handicap accessible. This information is key in emergency situations. Each location of the emergency lights has features that enable each user to edit. For example, if the blue light goes out, the information can be updated. We found that there are some locations that have no emergency blue lights. I would like to have some blue emergency phones located near the areas of Moakely Center, Hart Hall, Burnell Hall and in between Pope Hall and the Science and Mathematics Center. 


Toxic and Environmental Justice Populations in Medford, Massachusetts

MassGis has provided us with data of toxic sites and areas of environmental justice (EJ) populations. This project was to look at data of Environmental Justice, which is data on low income households, and/or households that don’t speak English very well and find out the area of risk from toxic sites. This map depicts those levels of toxic sites and the proximity of environmental justice areas located within in Medford, MA.


Process: By using the community/town boundaries data provided from MassGIS, I calculated the total area of the town. Then I determined the total area of environmental justice area of the town by using the data from MassGIS within the Medford boundaries. To determine the total area of the town that is non-environmental justice we subtracted the total area of the environmental justice areas of the town from the total area of the town. I mapped the total environmental justice area that was in a 2000 meter radius of a toxic site by utilizing geoprocessing tools found in ArcMap. I found the non-environmental justice group that fell within a 2000 meter area of a toxic site by utilizing those same tools.
                To determine the total percent of the town that is environmental justice I divided the total area of environmental justice by the total area of the town and multiplied by 100. For the total percent of the town that is non-environmental justice I subtracted 100% from 26% to get my result. I looked at the result of the total area of the town and the total area of the town that is environmental justice that falls within a 200 meter radius of a toxic site, and since they are the same, that makes the total percent of the town that is within that radius of a toxic site is 100%. To get the total percent of the non-environmental justice within a 2000 meter radius I divided the total area by the non-environmental justice total area.

Table 1:
Medford, MA
Total Area (sq. km)
Town
21.86
Environmental Justice
5.70
Non-Environmental Justice
16.16
Environmental Justice within a 2000 meter radius of a toxic site
5.70
Non-EJ within a 2000 meter radius of a toxic site
13.01


Table 2:
Medford, MA
Total Percent
Percent of the town that is Environmental Justice
26%
Percent of the town that is Non- Environmental Justice
74%
Percent of Environmental Justice within a 2000 meter radius
100%
Percent of Non-Environmental Justice within a 2000 meter radius
80%

Results and Conclusions: The data suggests that there is a huge concern with toxic danger in most of Medford, Massachusetts. Even the Non-Environmental Justice group would be affected. Accurate population accounts should be taken into consideration. 


Food on the East Coast

This map shows seven unique locations in with a "food" theme. In ArcGIS, I geocoded their locations on a map. By configuring the pop-up with each location, I also included the companies address and website. Starting in Maine, I located a lobster outlet, then in Boston, I located a food festival, in Rhode Island I located a food truck festival, in Connecticut, I located a farmers market, in New York, I located a dessert bar, and in Pennsylvania I located a steak house. Click on a star to discover more!